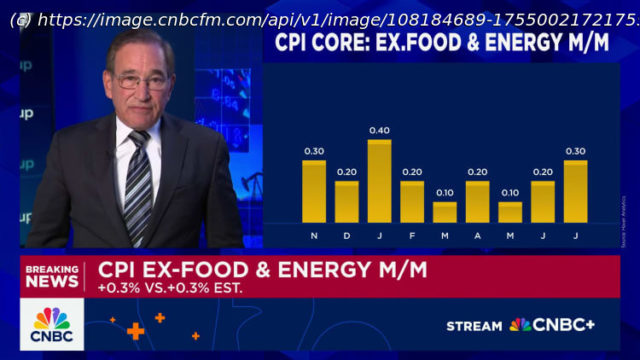
The consumer price index rose 2.7% in July on an annual basis. There’s some evidence tariffs are putting upward pressure on inflation, economists said.
The consumer price index rose 2.7% in July on an annual basis, according to the Bureau of Labor Statistics.
« Core » goods prices are at their highest annual inflation rate in about two years, evidence that Trump administration tariff policy is feeding through to higher prices, economists said.
Inflation held steady in July as price declines for staples like groceries and gasoline helped offset price increases for consumers.
However, there were worrying signs under the surface, including evidence that Trump administration policies are stoking inflation for certain goods and services, economists said. Those effects will likely become more pronounced later this year, they said.
« Tariff and immigration policy fingerprints are all over the report », Mark Zandi, chief economist of Moody’s, said.
« The tariff and immigration effects aren’t screaming at us, but they’re certainly speaking very loudly and over the next couple months they’ll start yelling », Zandi said.
The consumer price index rose 2.7% in July relative to a year earlier, unchanged from the prior month and less than expected, the Bureau of Labor Statistics reported Tuesday.
CPI is a widely used measure of inflation that tracks how quickly prices rise or fall for a basket of goods and services, from haircuts to coffee, clothing and concert tickets.
In July, grocery and gasoline prices declined — or, deflated — by a respective 0.1% and 2.2% on a monthly basis from June, according to CPI data.
Economists like to look at inflation data that strips out energy and food prices, which can be volatile from month to month.


