Array
Through Monday, Nov. 4, 83 million Americans had already cast their ballots in the 2024 election. On Tuesday, Nov. 5 — Election Day — millions more will join them.
Their votes this year will matter more than ever: According to 538’s forecasts for the White House, U.S. Senate and U.S. House, control of the federal government is firmly up for grabs. Our final model runs (published at 6 a.m. Eastern on Nov. 5) give Republicans a roughly 9-in-10 chance of winning control of the Senate, while the House and presidency are both toss-ups. The race for the White House, in fact, may be the closest presidential election in over a century.The presidency
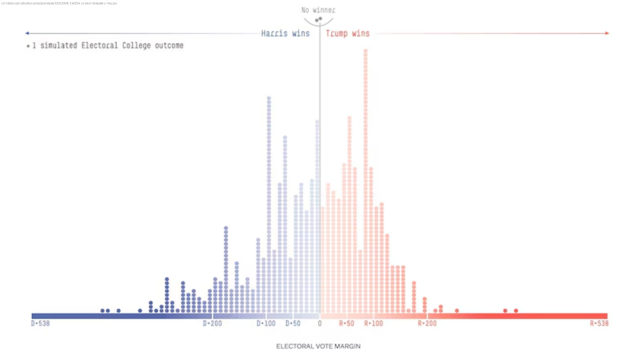
Let’s start with the race everyone is watching. According to 538’s final presidential forecast, Vice President Kamala Harris has a 50-in-100 chance of winning the Electoral College after all votes are counted (which could take a few days). We give former President Donald Trump a 49-in-100 chance to win.* Practically speaking, those odds are virtually indistinguishable — about the same as flipping a coin and getting heads versus tails.
Statistically, too, there is no meaningful difference between a 50-in-100 chance and a 49-in-100 chance. Small changes in the available polling data or settings of our model could easily change a 50-in-100 edge to 51-in-100 or 49-in-100. That’s all to say that our overall characterization of the race is more important than the precise probability — or which candidate is technically «ahead.»
More than any other factor, our forecast is so close because the polls are so close. According to our final polling averages, the margin between Trump and Harris is 2.1 percentage points or fewer in all seven swing states. Trump currently leads by 2.1 points in Arizona, 0.9 points in North Carolina, 0.8 points in Georgia and 0.3 points in Nevada. Harris is up by 1.0 point in Wisconsin and in Michigan. And in Pennsylvania (the state that’s most likely to decide the outcome of the election), Harris has a tiny 0.2-point edge.
But it is worth stressing that the polls will not be exactly correct. Polls overestimated Democrats by an average of 3-4 points in both the 2016 and 2020 presidential elections, for example, and overestimated Republicans by an average of 2.5 points in the 2012 presidential election. Our election model expects polls this year to be off by 3.8 points on average, although it could be more or less — and our model thinks this error is equally likely to favor Democrats as Republicans.
In other words, you should not expect polls in presidential races to be perfectly accurate. You should expect them to be as imperfect as they have been historically. And in a race with very narrow advantages for the leader in each key state, that means there’s a wide range of potential outcomes in the election.
And that’s why we’ve been saying the race isn’t necessarily going to be close just because the polls are.


