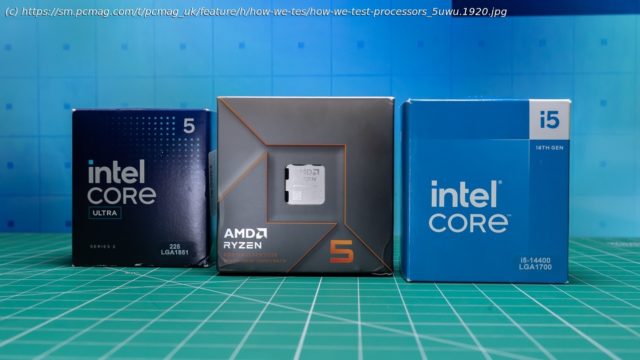
Standardized, repeatable testing underpins everything we review at PCMag. Here’s how we evaluate desktop CPUs, from pure processing trials to gauging a processor’s nuanced effects on graphics performance.
The process of reviewing desktop CPUs at PCMag carries on core traditions that date back to the establishment of PC Labs in 1984: We compare each CPU in its category based on price, features, upgrades from previous generations, and in-house performance tests.
To evaluate performance, we use a suite of software benchmark tests and real-world applications and games, carefully chosen to highlight the strengths and weaknesses of a tested CPU to see how it handles different situations. Our desktop CPU testing breaks down into two rough classes: productivity and graphics.
Modern-day processors are highly complex pieces of technology with multiple distinct components inside. Most nowadays are essentially a system-on-a-chip (SoC) with many of the most critical pieces of circuitry now integrated into the processor. This complicates testing CPUs, requiring multiple benchmarking methods to evaluate each processor’s capabilities. Here, I’ll review how we benchmark processors at PC Labs and the test systems I use.The Test Hardware
As AMD and Intel CPUs are mutually incompatible at the motherboard level, I maintain a separate test bed for each brand of chip. I aim to maintain parity in all sensible areas. Both of my late-model test beds for consumer CPUs (for AMD AM5 and Intel Socket 1851) are Praxis Wetbench open-air cases with separate but identical SilverStone Hela 1650R Platinum (1,650-watt) power supplies and Corsair iCue Link Titan 360 RX LCD CPU coolers. Each system also houses a 1TB PCIe 4.0 M.2 SSD with Windows 11 installed. I also maintain other testbeds for legacy sockets like AMD AM4 and Intel LGA 1200, and build out new testbeds as needed for special releases like AMD’s Ryzen Threadripper as those chips release.
The memory capacity is identical on both main (AM5 and LGA 1851) systems, with two 16GB sticks of DDR5 RAM, but the same RAM is not always used in each system. One of the processor’s many parts is the memory controller, which typically improves over time. I test all processors using RAM clocked at their max official clock speed so that improvements in this area contribute to any change in performance. An Nvidia GeForce RTX 5090 graphics card is the only internal component swapped between the two systems.
I currently use a Gigabyte X870E Aorus Master motherboard for AMD-based socket AM5 processors. I test Intel processors supporting LGA 1851 using an ASRock Z890 Taichi motherboard.Cinebench 2024
Maxon has been crafting new versions of its Cinebench software for more than a decade now, and the benchmarking app is now a clear industry favorite as a CPU-performance drag race. The Cinebench benchmarks are built to use the same rendering engines as Maxon’s multimedia content creation tools, and they help to show how well a PC will perform when rendering content made with that software.
The latest version of Cinebench I use is Cinebench 2024, based on Maxon’s Redshift rendering engine, which is employed in the company’s Cinema 4D software. It renders a scene continuously for 10 minutes and then finishes rendering the final scene when the timer runs out. The Cinebench score we report is based on how quickly, and how many times, the scene is rendered.
We run this test in two iterations: to measure multi-threaded performance and single-threaded performance separately. The score reported in each case is meaningful only in relation to other Cinebench 2024 scores.Blender Benchmark 3.1
Blender is another popular tool for creating digital content like 3D models and 3D environments. Blender’s developer has recently released the Blender Benchmark software as a standalone testing utility (which works with various versions of the Blender core program) that helps to provide standardized and consistent benchmark results. We currently use Blender Benchmark 3.1 and, within it, select Blender version 4.3.0 to run for all tests.
This test tends to respond strongly to increases in core count and clock speed, but shows less change from different graphics cards installed across the same CPU. It renders three sample models called Monster, Classroom, and Junkshop, kicking back a score in samples per minute. Those are the scores we report, useful in comparison to other tested CPUs. Power and Thermal Testing
During the Cinebench and Blender tests, I also measure the benchmark system’s power consumption and the CPU’s operating temperature. Both tests are intensely demanding on the hardware, pushing the parts toward 100% utilization.


