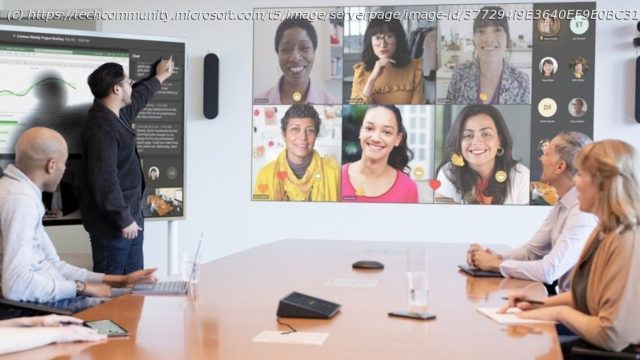
In 2021, nearly three-quarters of employees experienced a 70% increase in meetings after organizations shifted to remote work due to the onset of the
In 2021, nearly three-quarters of employees experienced a 70% increase in meetings after organizations shifted to remote work due to the onset of the COVID-19 pandemic.¹ When 43% of remote workers state they do not feel included in meetings², the natural question is, how can we make meetings more effective and inclusive? We were curious too, so we decided to survey a large number of Microsoft customers who wanted to improve meeting experiences in their organizations. As it happens, this was the first large-scale study that we’re aware of conducted by a technology company to determine what makes meetings effective and inclusive. We used statistical, mathematical, and machine learning techniques to analyze meeting dynamics through survey data and anonymous telemetry. This enabled us to build a model to understand and predict which meetings would be effective, and why. Criteria such as using an agenda, active participation, having video turned on, keeping meeting sizes small, and sharing pre-meeting material all ranked high for driving inclusiveness and effectiveness. Additionally, data analysis showed strong connections between meeting participation and attendees’ subjective perceptions of inclusiveness, sense of comfort, and meeting effectiveness. Since meetings are a permanent fixture of modern work, we encourage you to dive into the findings below and find new ways to promote behaviors that lead to more effective and inclusive meetings. We used two survey methodologies in tandem to measure meeting effectiveness and inclusiveness across Microsoft employees and a select group of Microsoft Teams customers:
The in-Teams survey methodology was designed with goals to:
Survey types and population groups have different survey response rates, adding another layer of sampling to our data collection. While this additional layer induces a «non-response» bias to the data, our analysis showed a negligible amount of bias that did not degrade the data utility. In-product survey
To understand the drivers of meeting effectiveness and inclusiveness, we began examining the strength of dependencies between user ratings on these criteria with expected factors including meeting duration, the number of participants, usage of audio/video/screen sharing, and presence of an agenda among others.


